
Pricing
Maintain your clinic's emphasis on patient care with our fully integrated dashboard. Effortlessly review historical data, upcoming appointments, and billing information at a glance.
Pricing details
Online Booking
Capture appointments online without extra front-desk workload.

SMS & Fax
Automate reminders, confirmations, and outbound communication.

Referrers Portal
Give referrers secure, real-time access to status updates and reports.

Online Forms
Collect referral and patient details before the appointment.
Unlock the power of data with QUBS Business Insights. Pose questions in natural language and receive precise answers accompanied by relevant visualisations, enabling a deeper understanding of your clinic's operations.
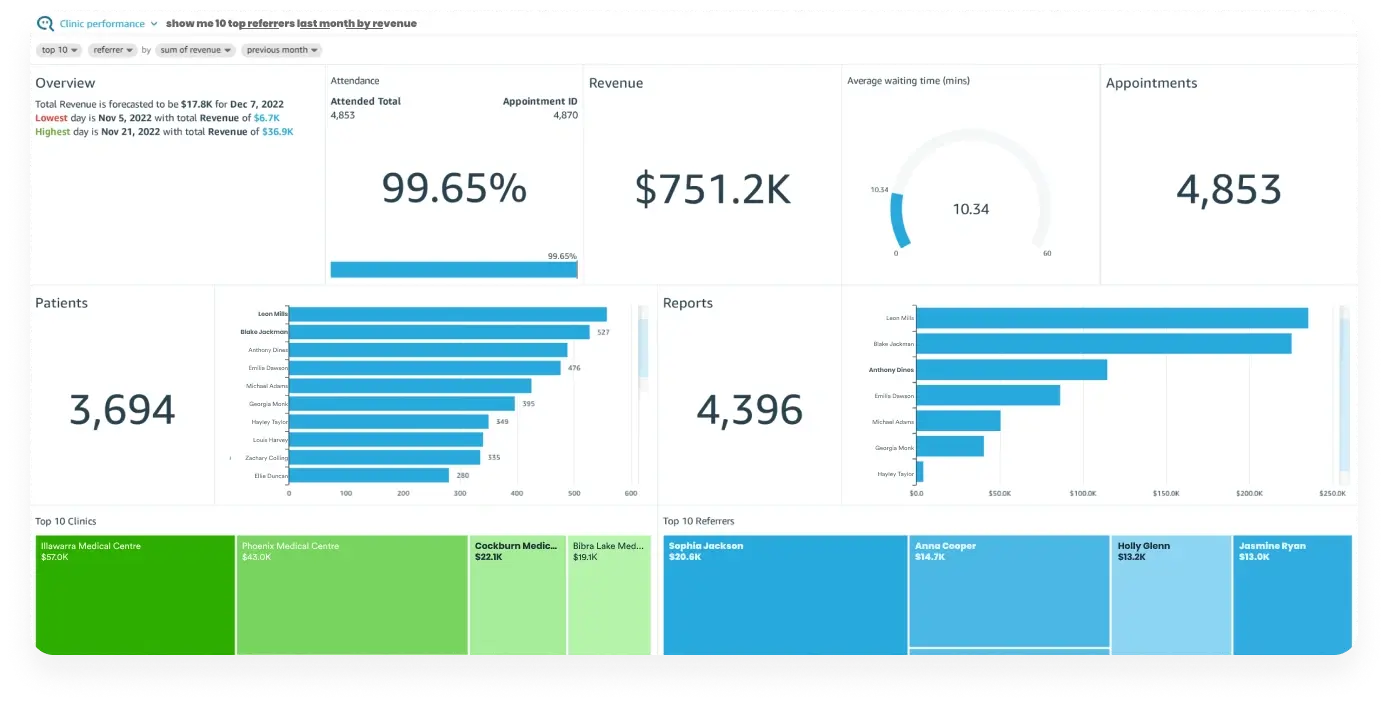
NLP (Natural Language Processing) empowers you to engage with your data effortlessly using natural language. Pose a question, and QUBS will deliver the answer through a report, dashboard, or visualisation, making information retrieval simpler and faster.

Schedule and automate your reports to be generated daily, weekly, or monthly, providing timely answers to all your QUBS-related queries.

Gain insights into your clinic's operations easily. Identify top referrers, patient wait times, best-performing receptionists, sonographers, radiographers, and more.

Easily print dashboards, export them as PDFs, or download as Excel reports to share insights with your team.

Access insights on the go with the QUBS mobile app for iOS and Android. Browse and interact with your dashboards through a user-friendly, mobile-optimised experience.
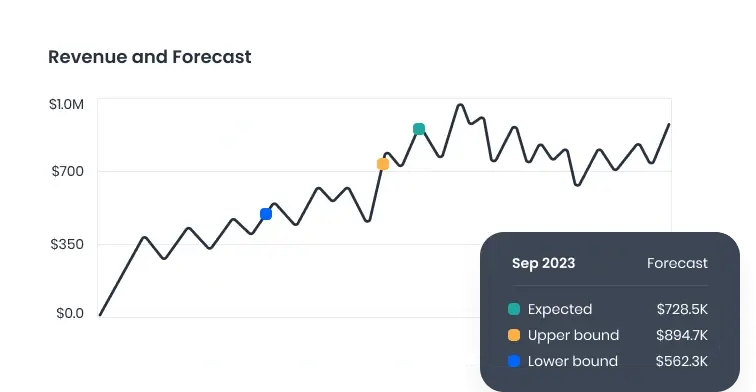
Track and compare the revenue performance of different modalities effortlessly with QUBS. Additionally, leverage our forecasting feature to anticipate future trends and make informed decisions.
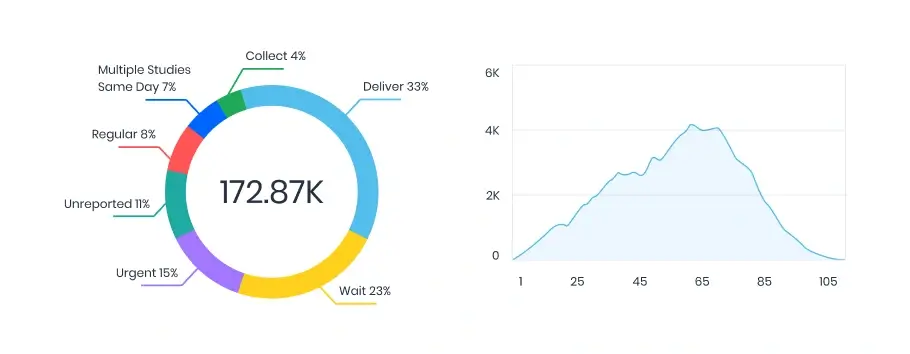
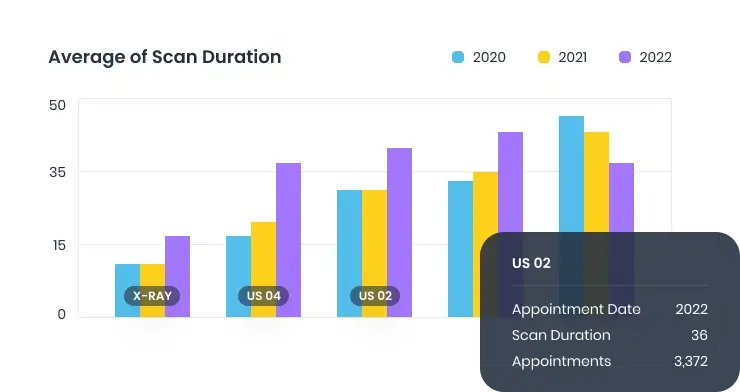
Gain deeper insights with QUBS by analysing the average scan duration per modality. This information can help optimise scheduling and improve overall operational efficiency.
Explore your key metrics and KPIs through our interactive dashboards, designed for ease of use. Our data visualisation tools offer diverse formats including charts, graphs, and maps, simplifying data interpretation and engagement.
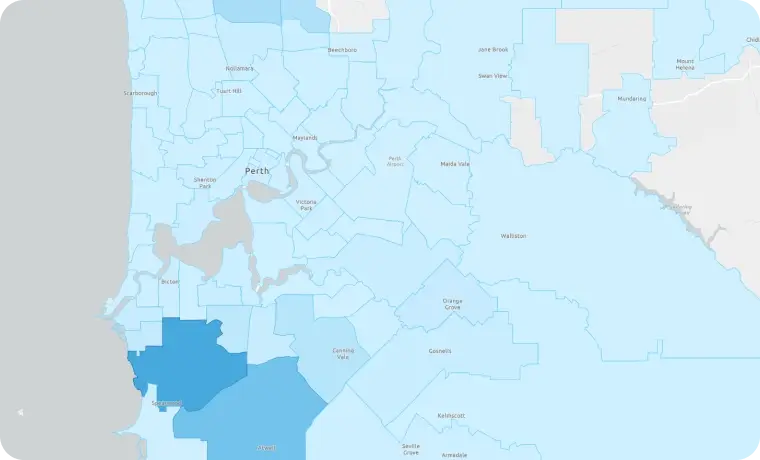
Identify geographical patterns of patient origins
effortlessly with QUBS.
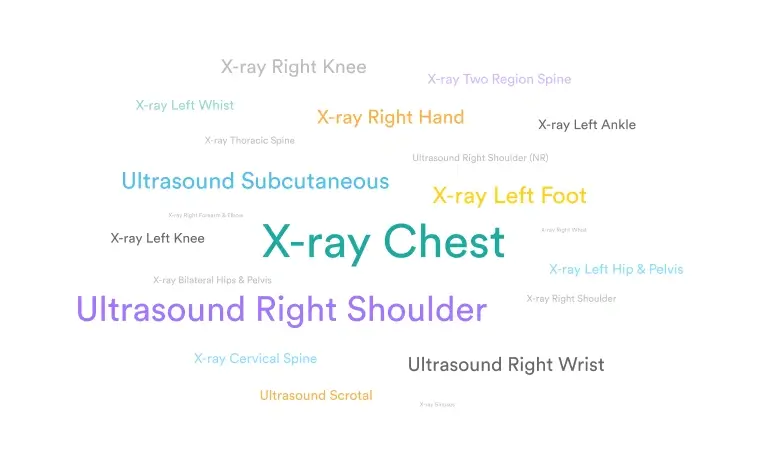
Generate a word cloud effortlessly to visualise the
frequency of modality usage.
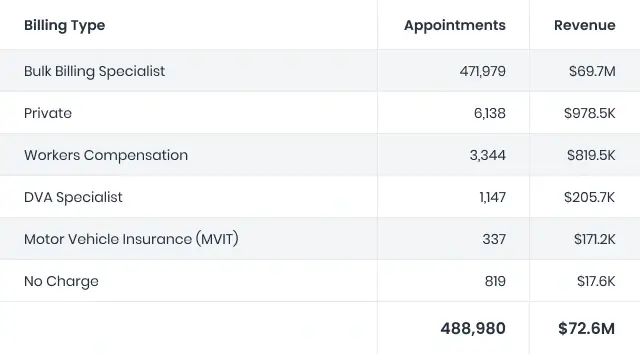
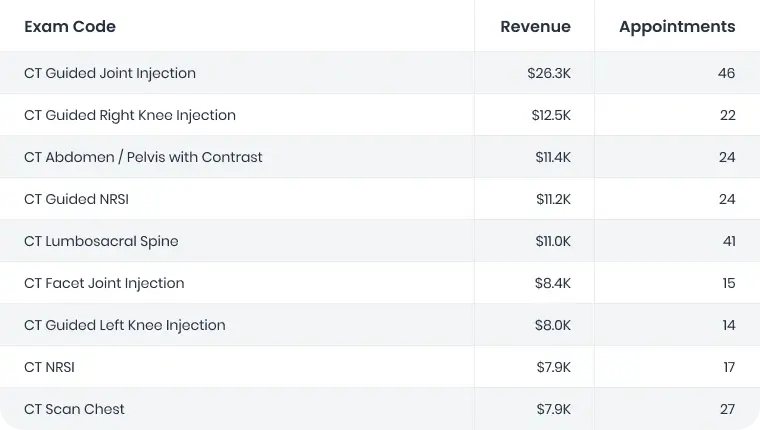
Evaluate revenue generation per modality at a
glance, aiding in financial analysis.
Monitor appointment schedules and attendance over time to
optimise patient management.
Maintain your clinic's emphasis on patient care with our fully integrated dashboard. Effortlessly review historical data, upcoming appointments, and billing information at a glance.
Pricing details
Platform fee
Embark on your clinic’s journey with QUBS to redefine reporting and optimise workflow. For a tailored solution, reach out to us, and let’s craft a custom package suited to your practice.
Pricing Contact Sales